Deep Representation Learning
of Spectroscopic Graphs
- Kelvin Lee,
- Christine Li,
- Brett McGuire,
- Kyle Crabtree
ISMS 2021—Talk FF09
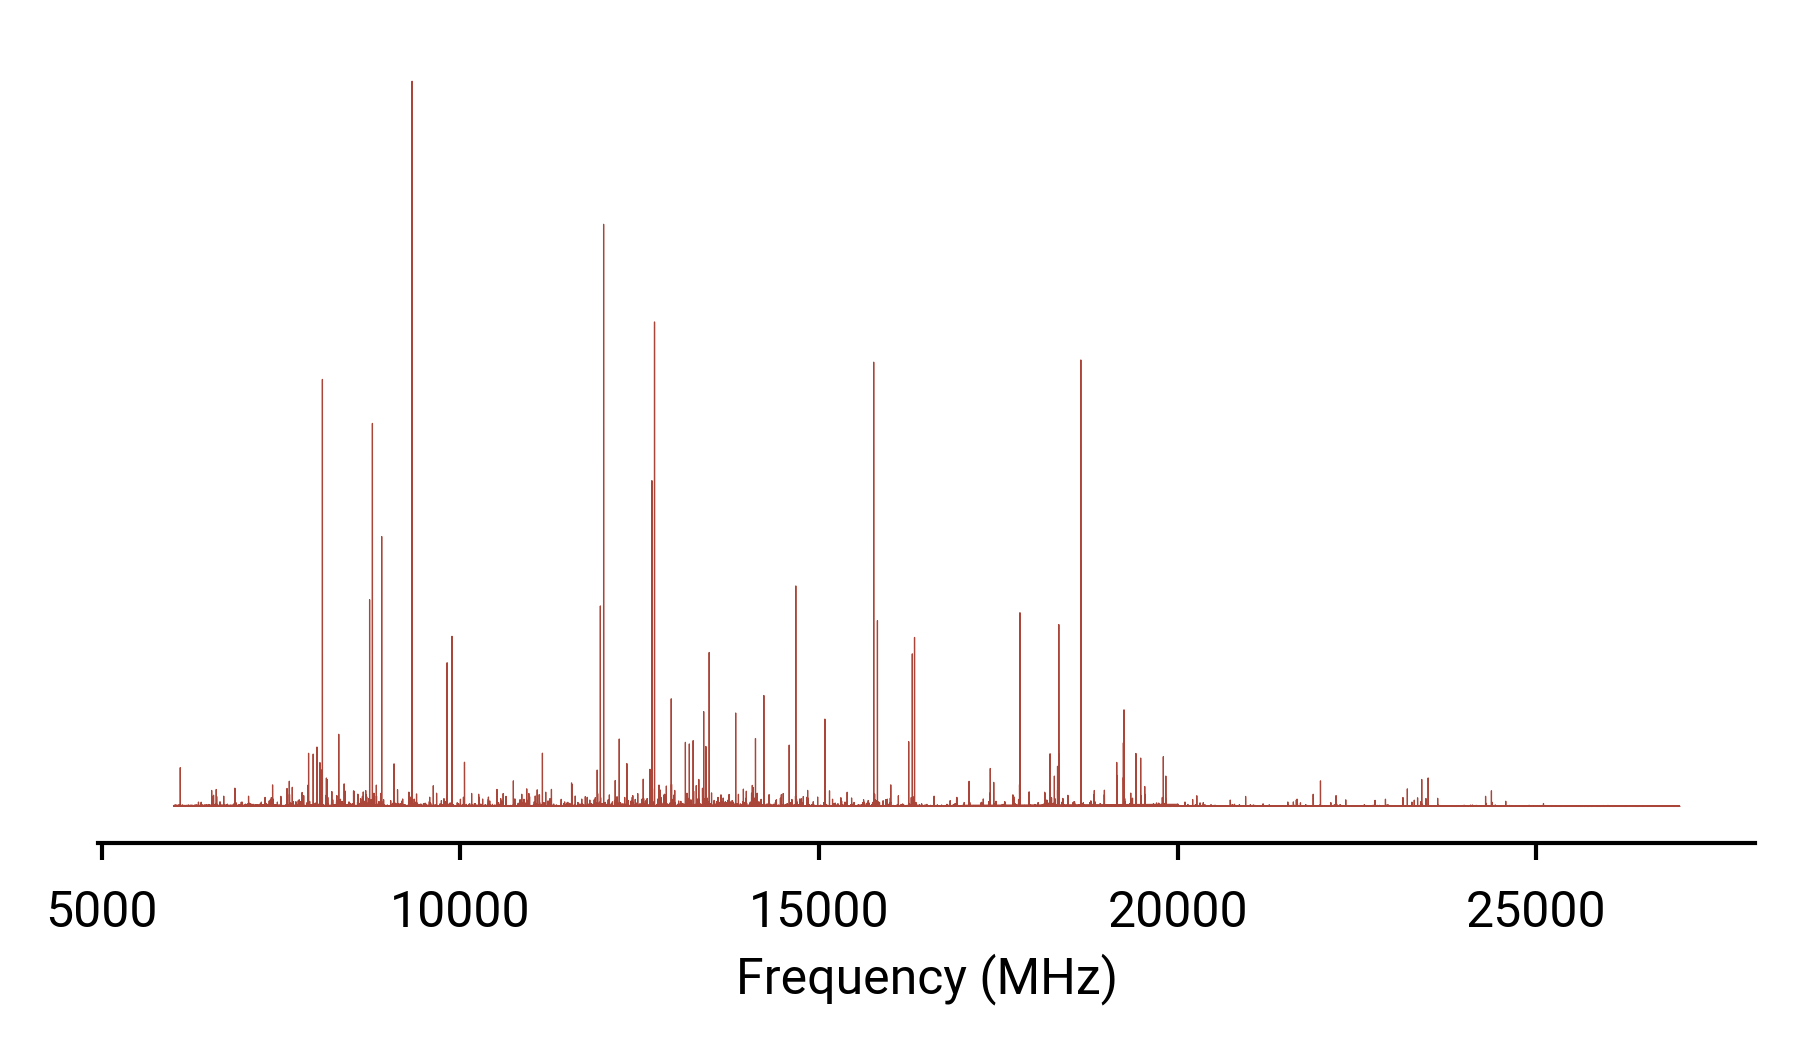
Scaling up molecular spectroscopy

High-resolution, high bandwidth data
Unknown molecule discovery
Potential benefits from machine learning
Unified encodings
Data compression
Mixture separation
$J, K_a, \lambda, F, \omega, +$
$A,B,C \rightarrow \nu, I$

Automating spectroscopic analysis
Machine learning as an attractive method for data processing;
Models are only as good as how the data is represented!
Frequency vs. intensity may be intuitive for humans, but not for machines.
- Ordering and scale
- Missing data
- Computational scaling
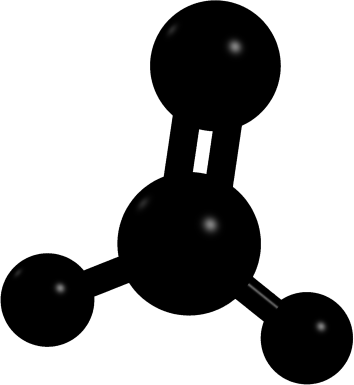
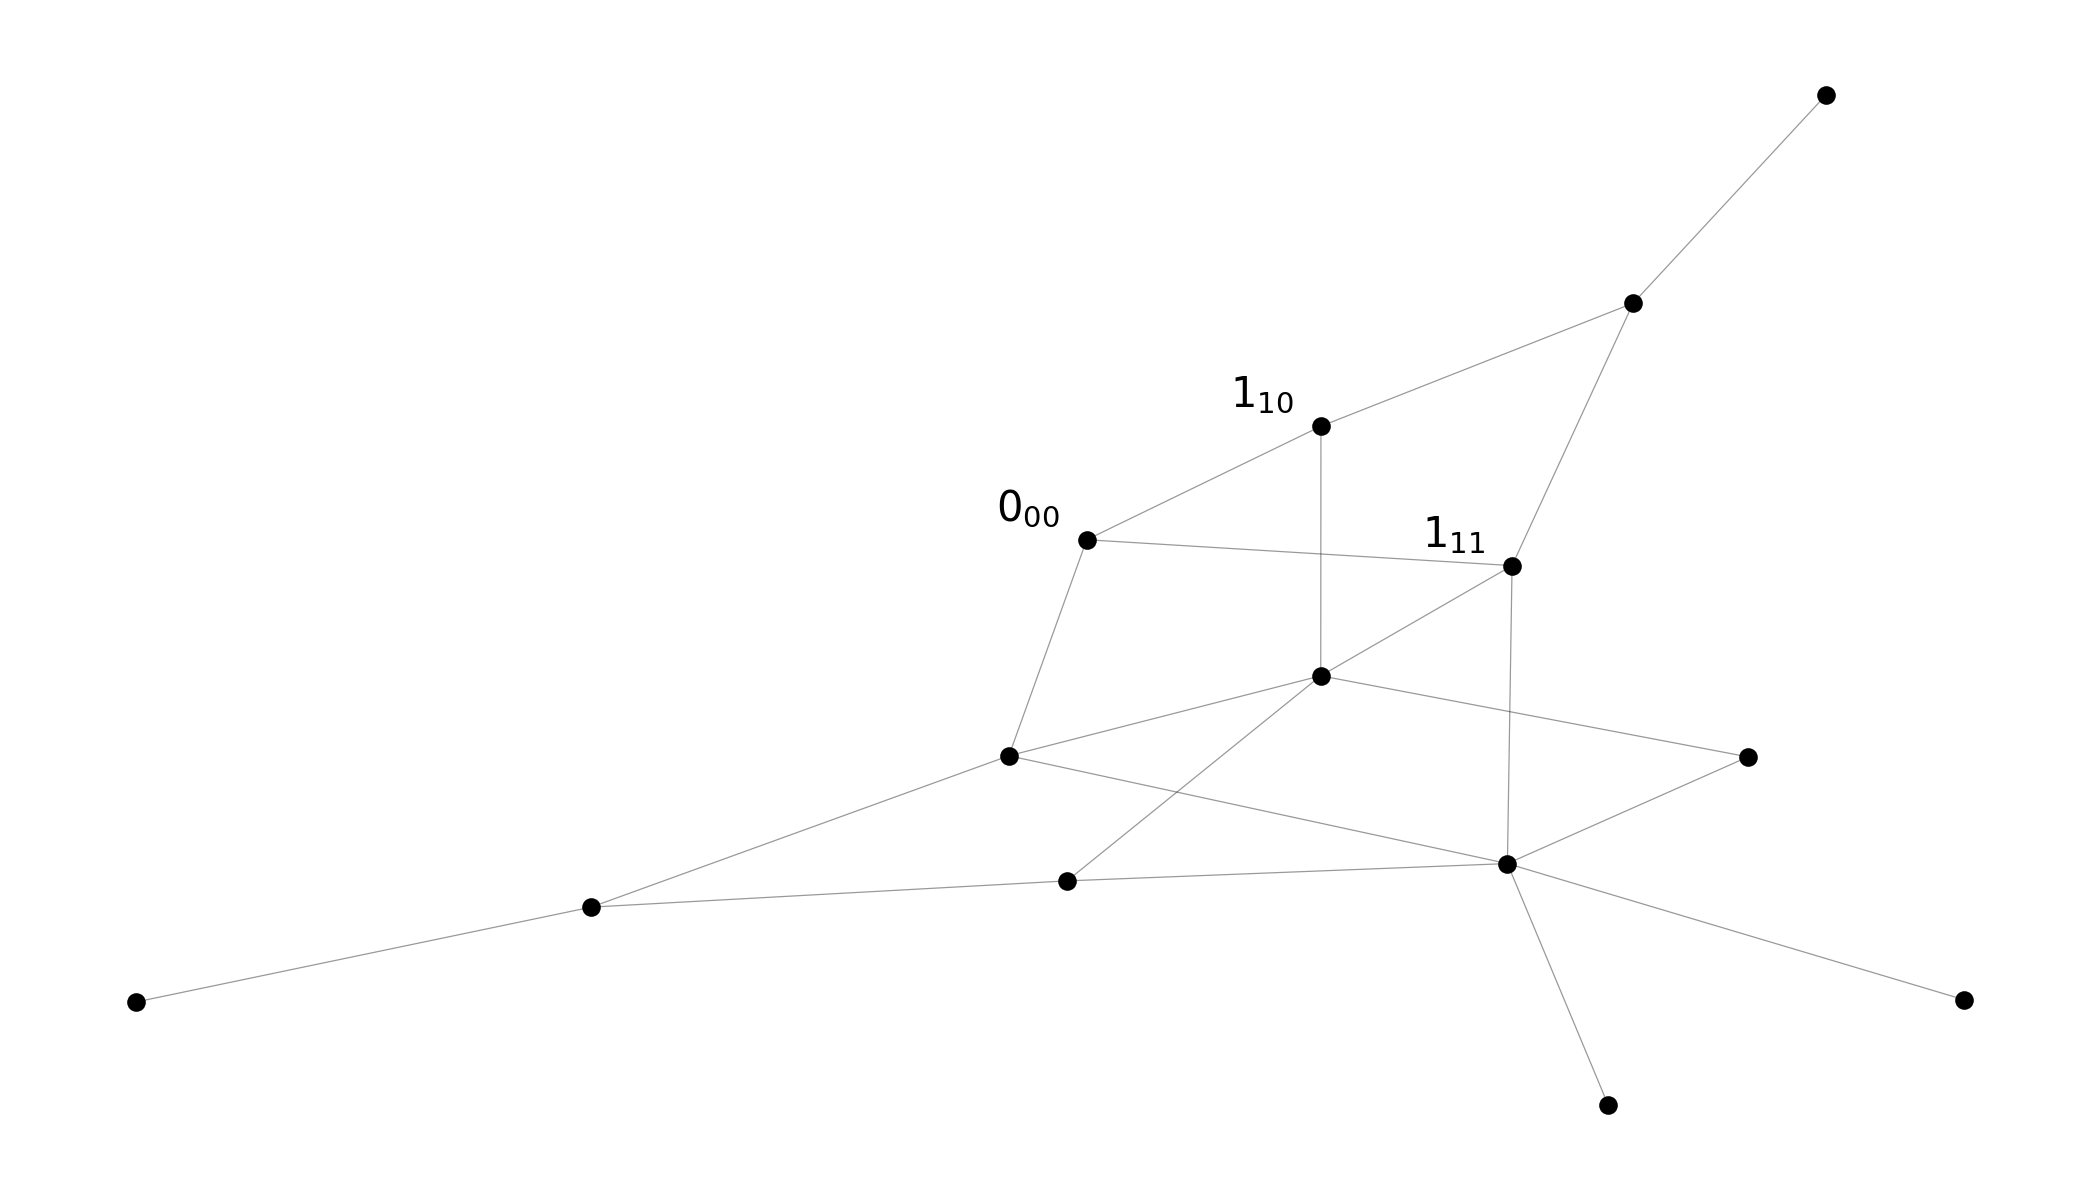
Spectroscopic graphs
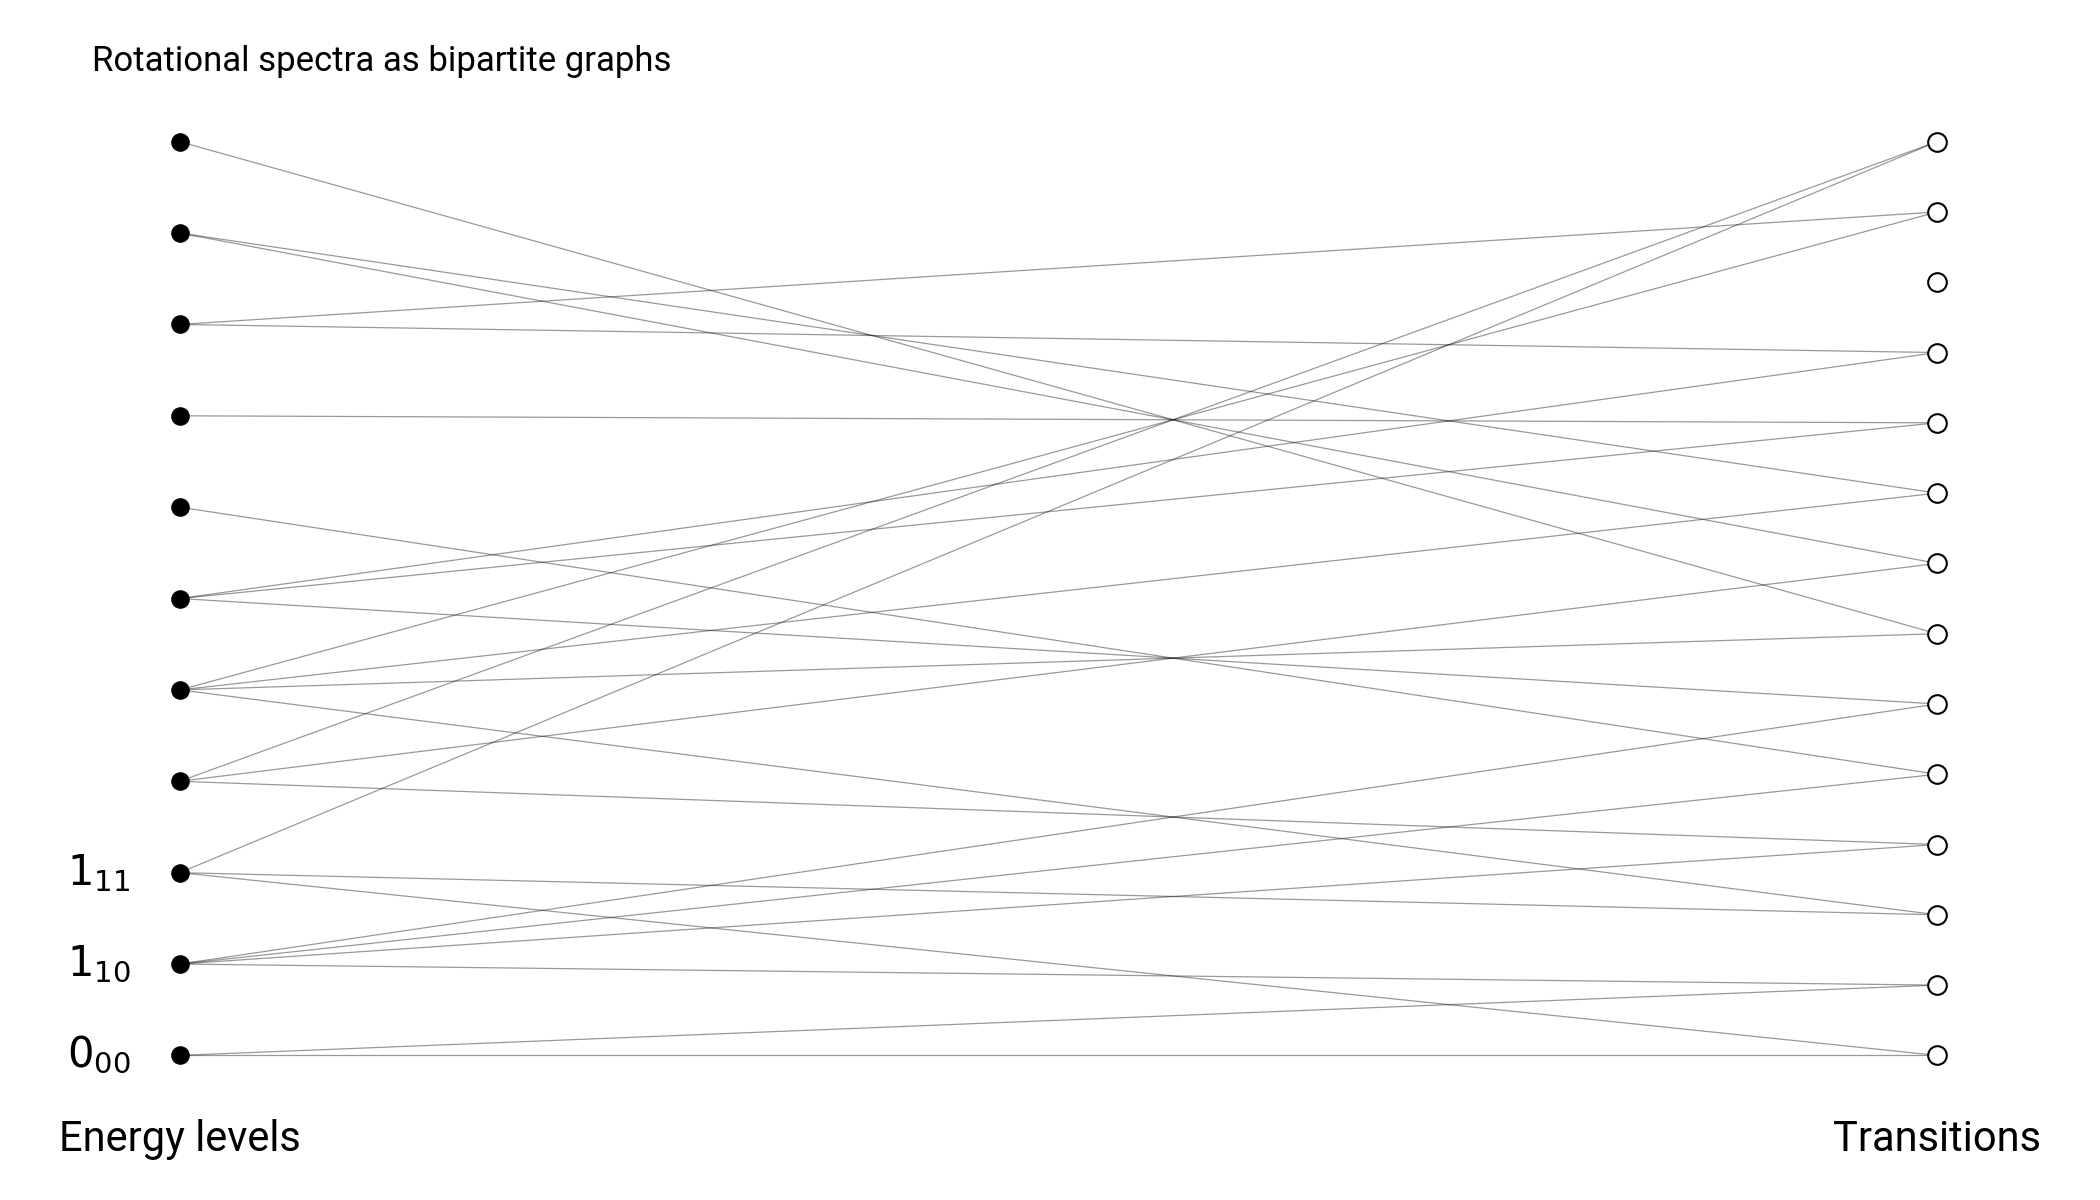
Energy nodes connected through transition nodes
Spectroscopic graphs

Energy nodes connected through transition edges
Graph neural networks
Symmetry properties
Non-uniformity
Inductive bias
Learning on multiple scales: from local neighborhoods to graphs
Open questions
Data generation
10,000 rigid rotor spectra from SPCAT
Uniform sampling in $\kappa$ with scale invariant $A,B,C$
$E, J, K_a, K_c$ embedded per node
Can process 230 graphs per second on Nvidia 3070
83,000 nodes, ~330,000 edges per batch (32 full graphs)
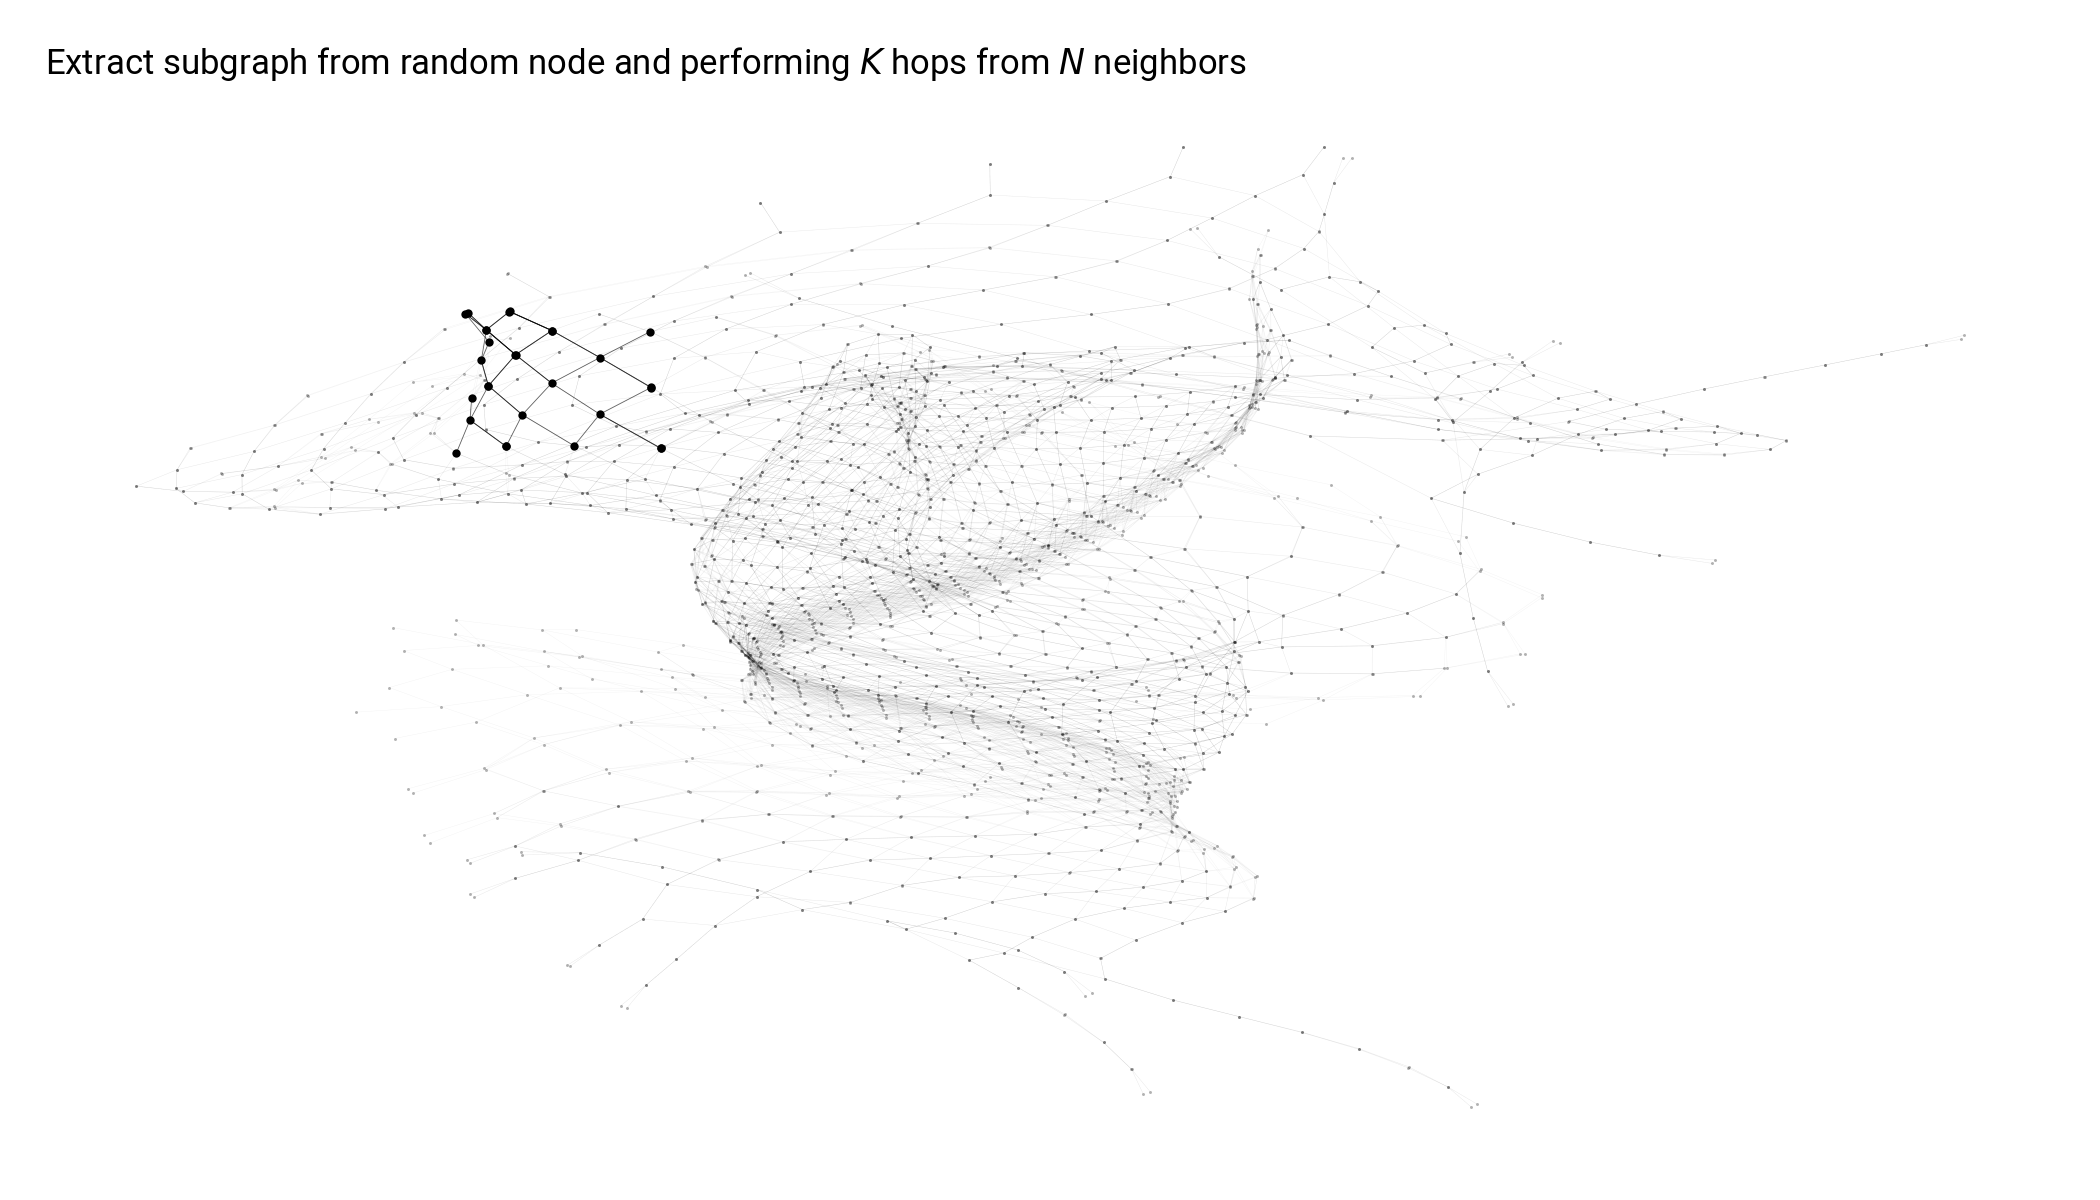
Node learning
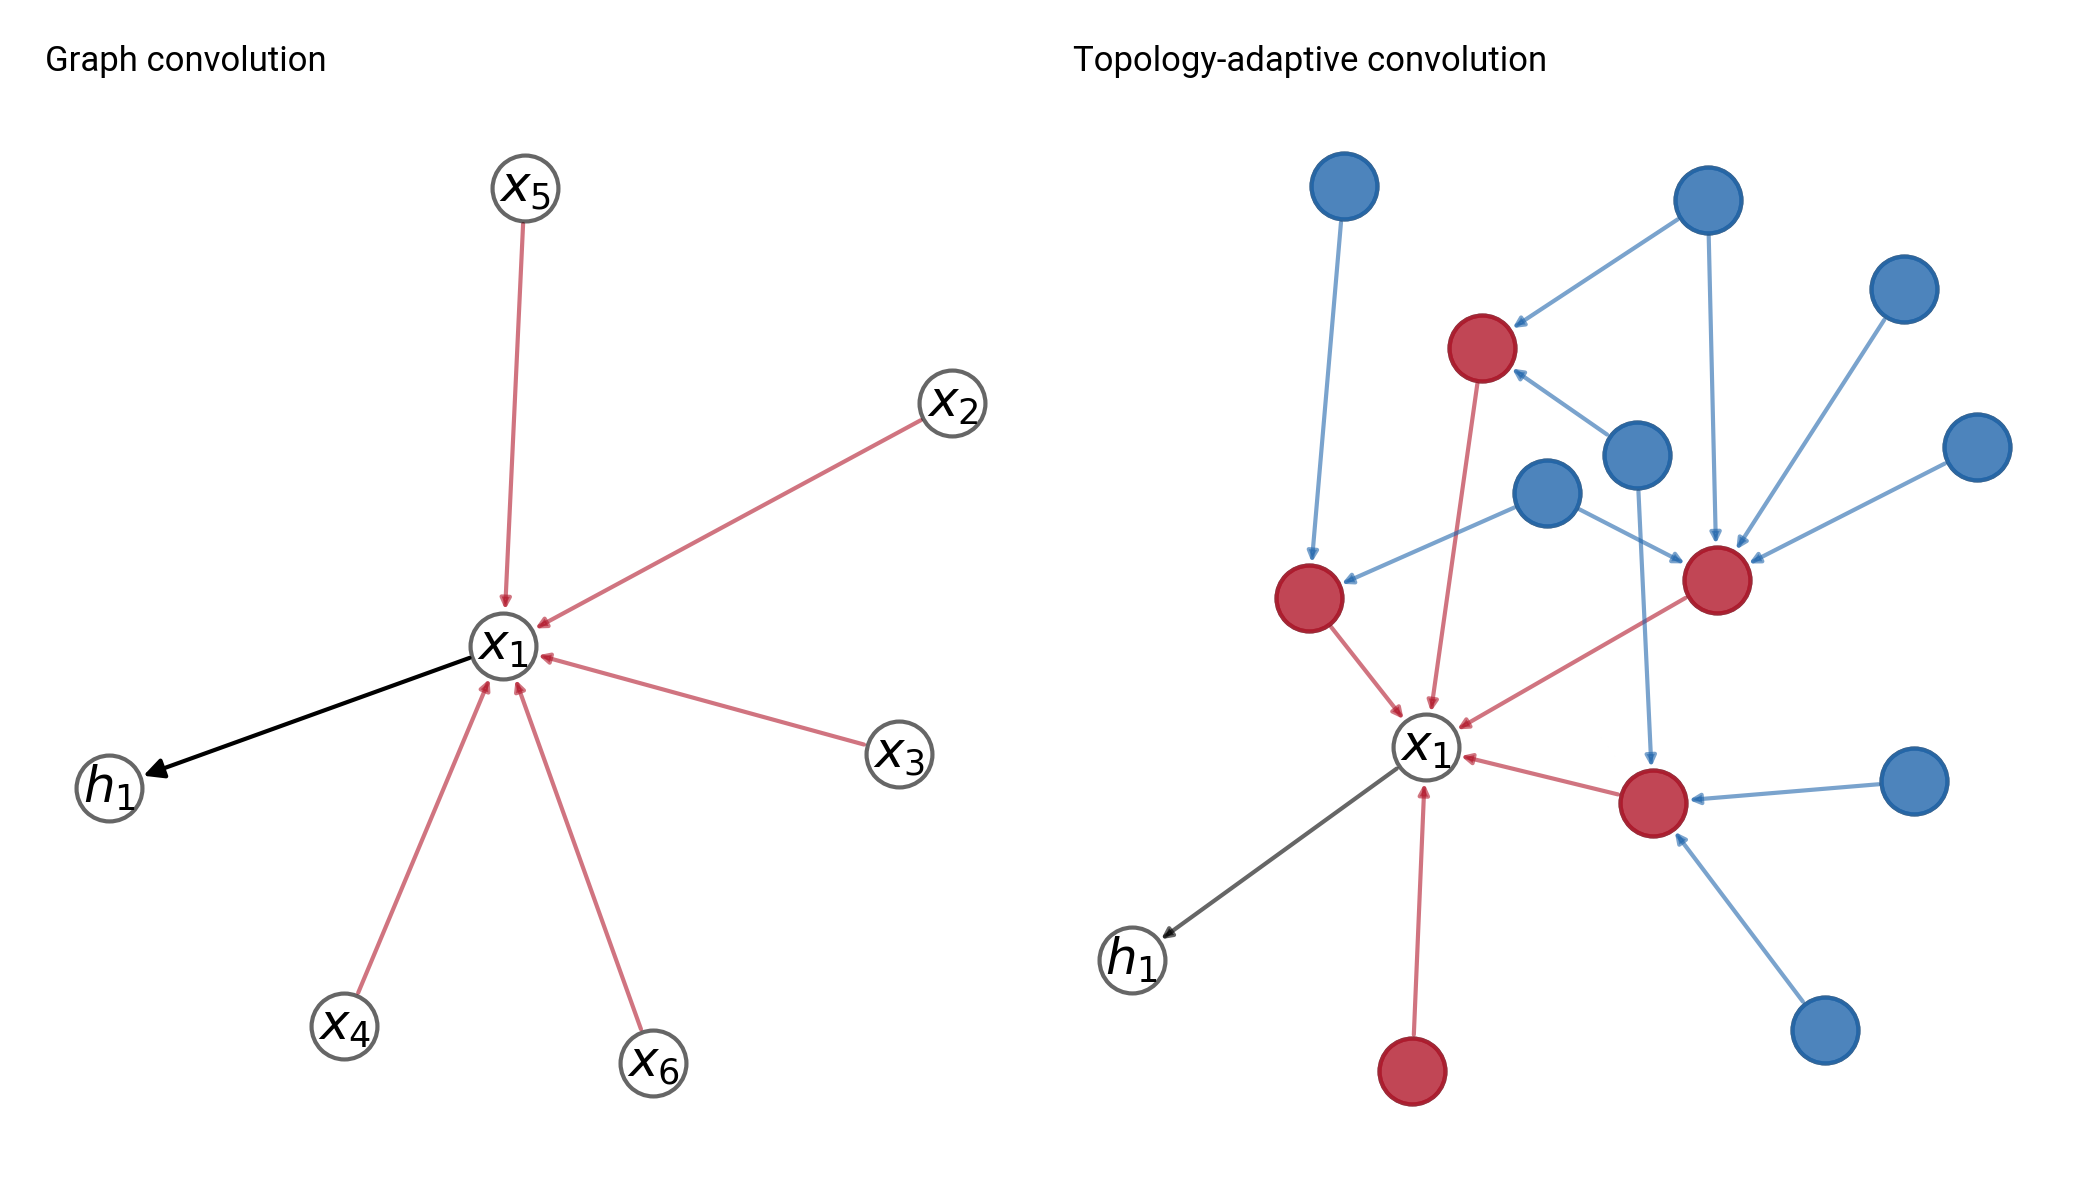
Aggregates information from up to K neighbors per node
Graph learning
$\rightarrow A, B, C$
Graph autoencoder
Self-supervised representations
What do graph neural networks learn from spectroscopic graphs?
Analyzing learned node/graph embeddings
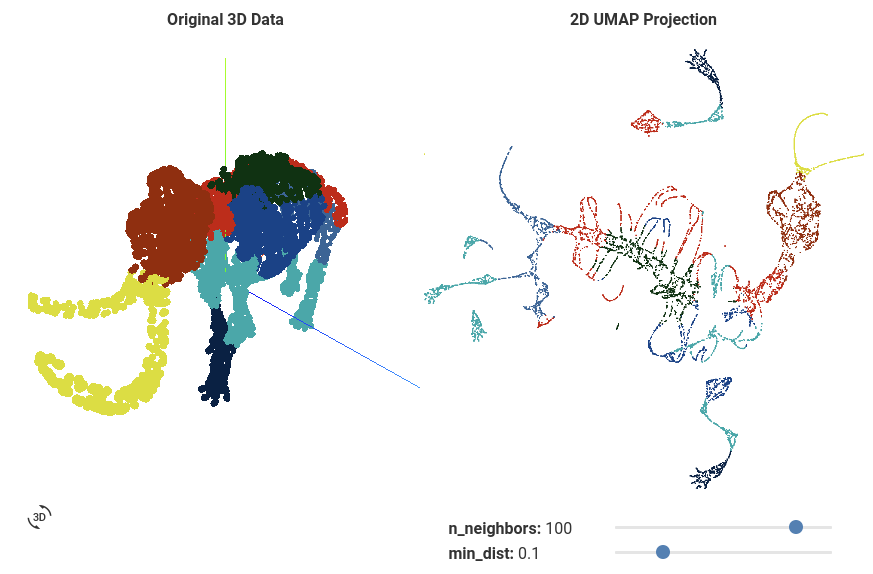
Use Uniform Manifold Approximation and Projection (UMAP)
Topology preserving 2D projection of high dimensional embeddings
What to look for
Local patterns
- Clustering of similar nodes
- Connectivity
Large scale patterns
- Relative locations of clusters
Analysis of prolate, oblate, and asymmetric top topology
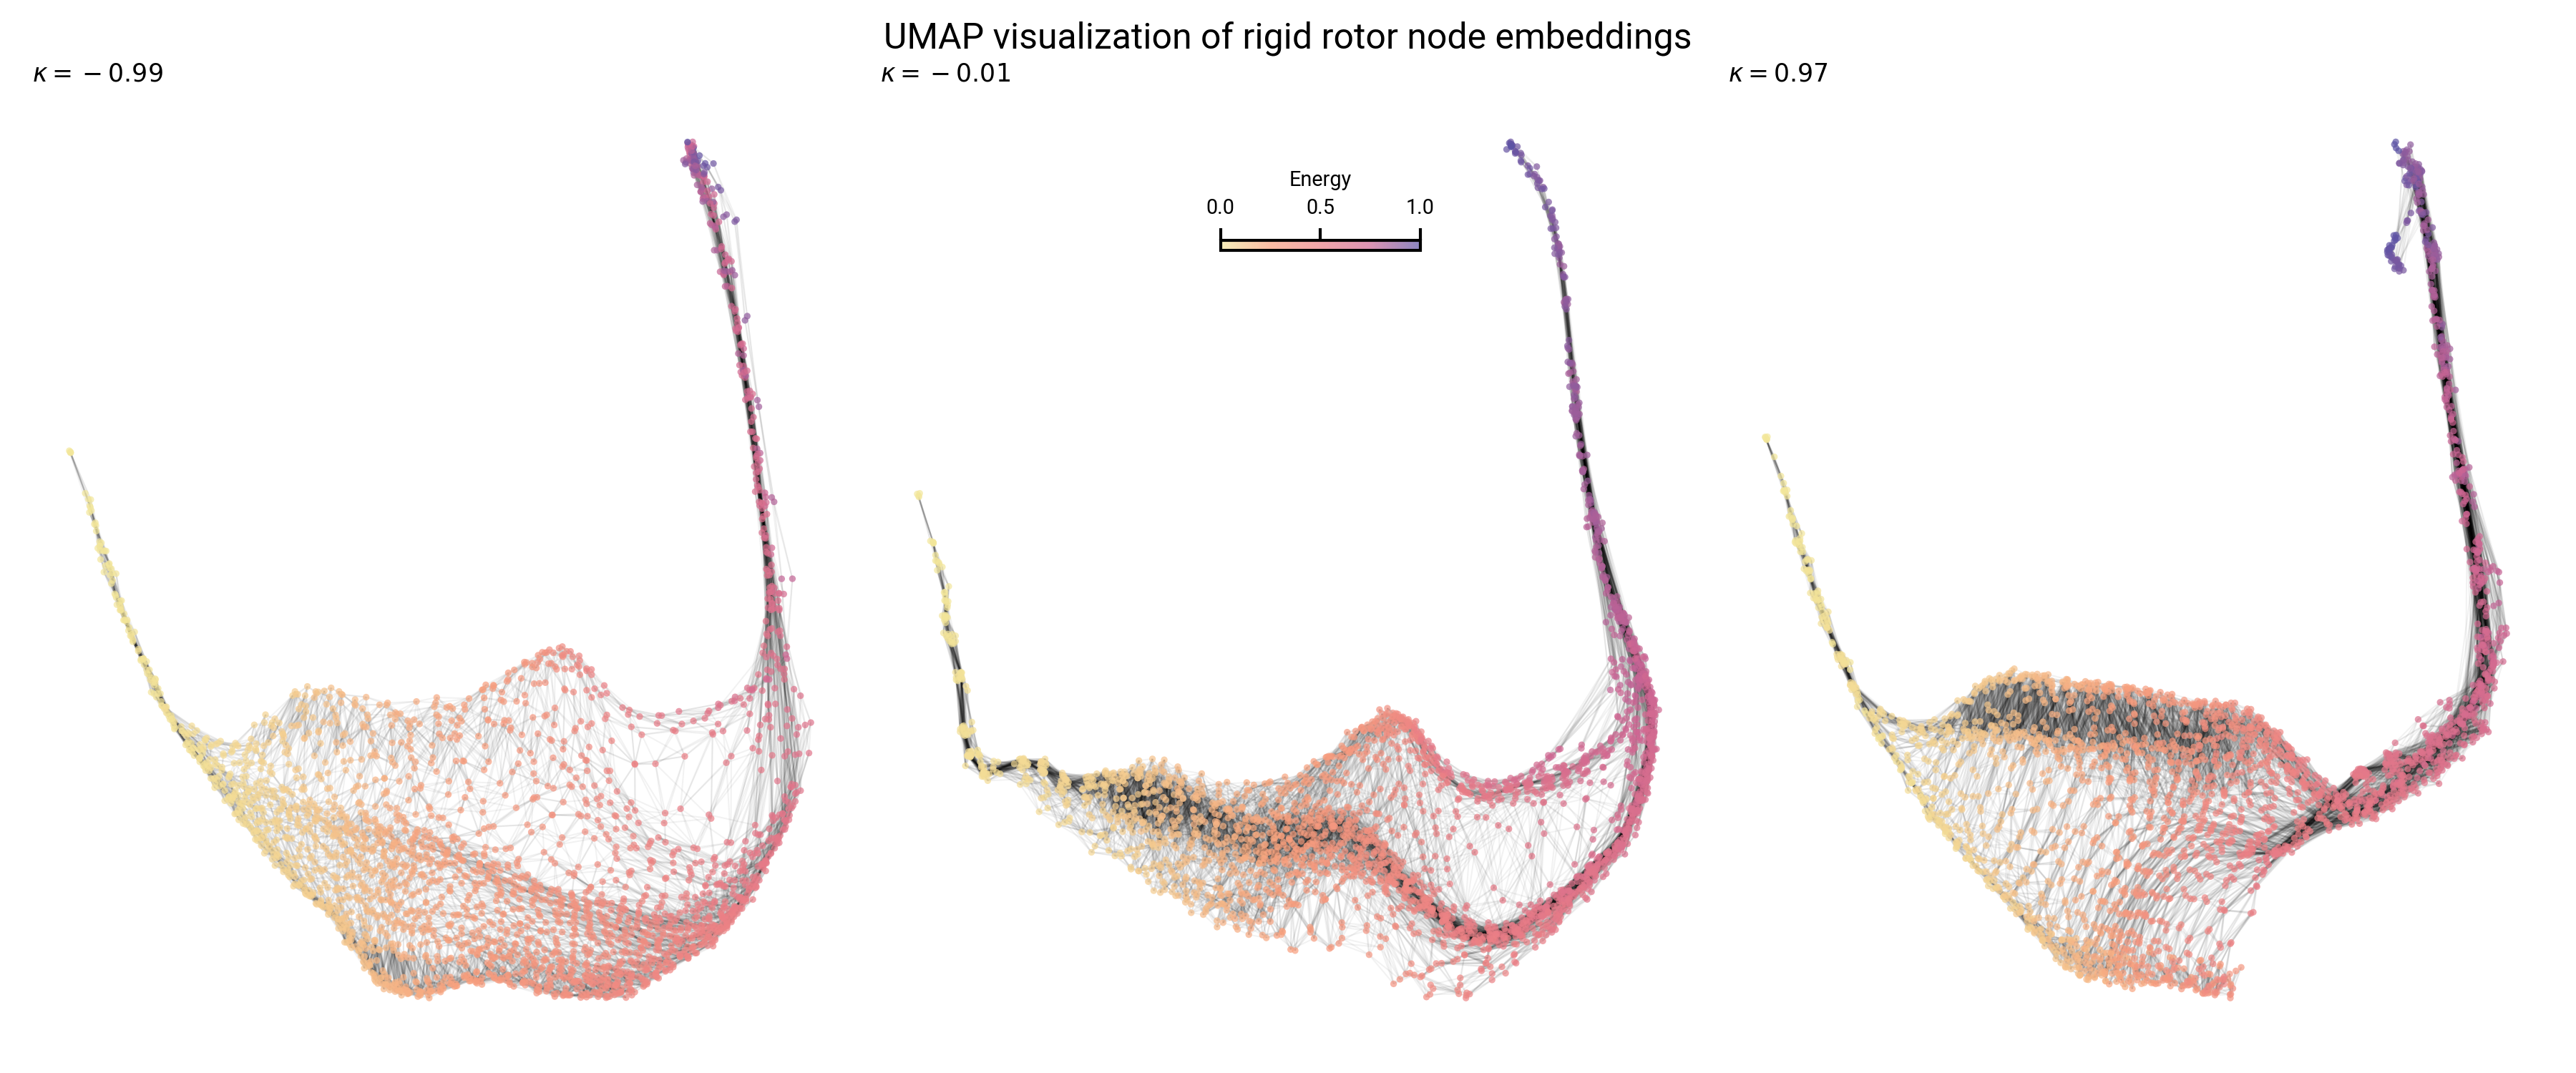
Graph layout differs with asymmetry: sparsity and boundaries
Topology of node embeddings contain energy information
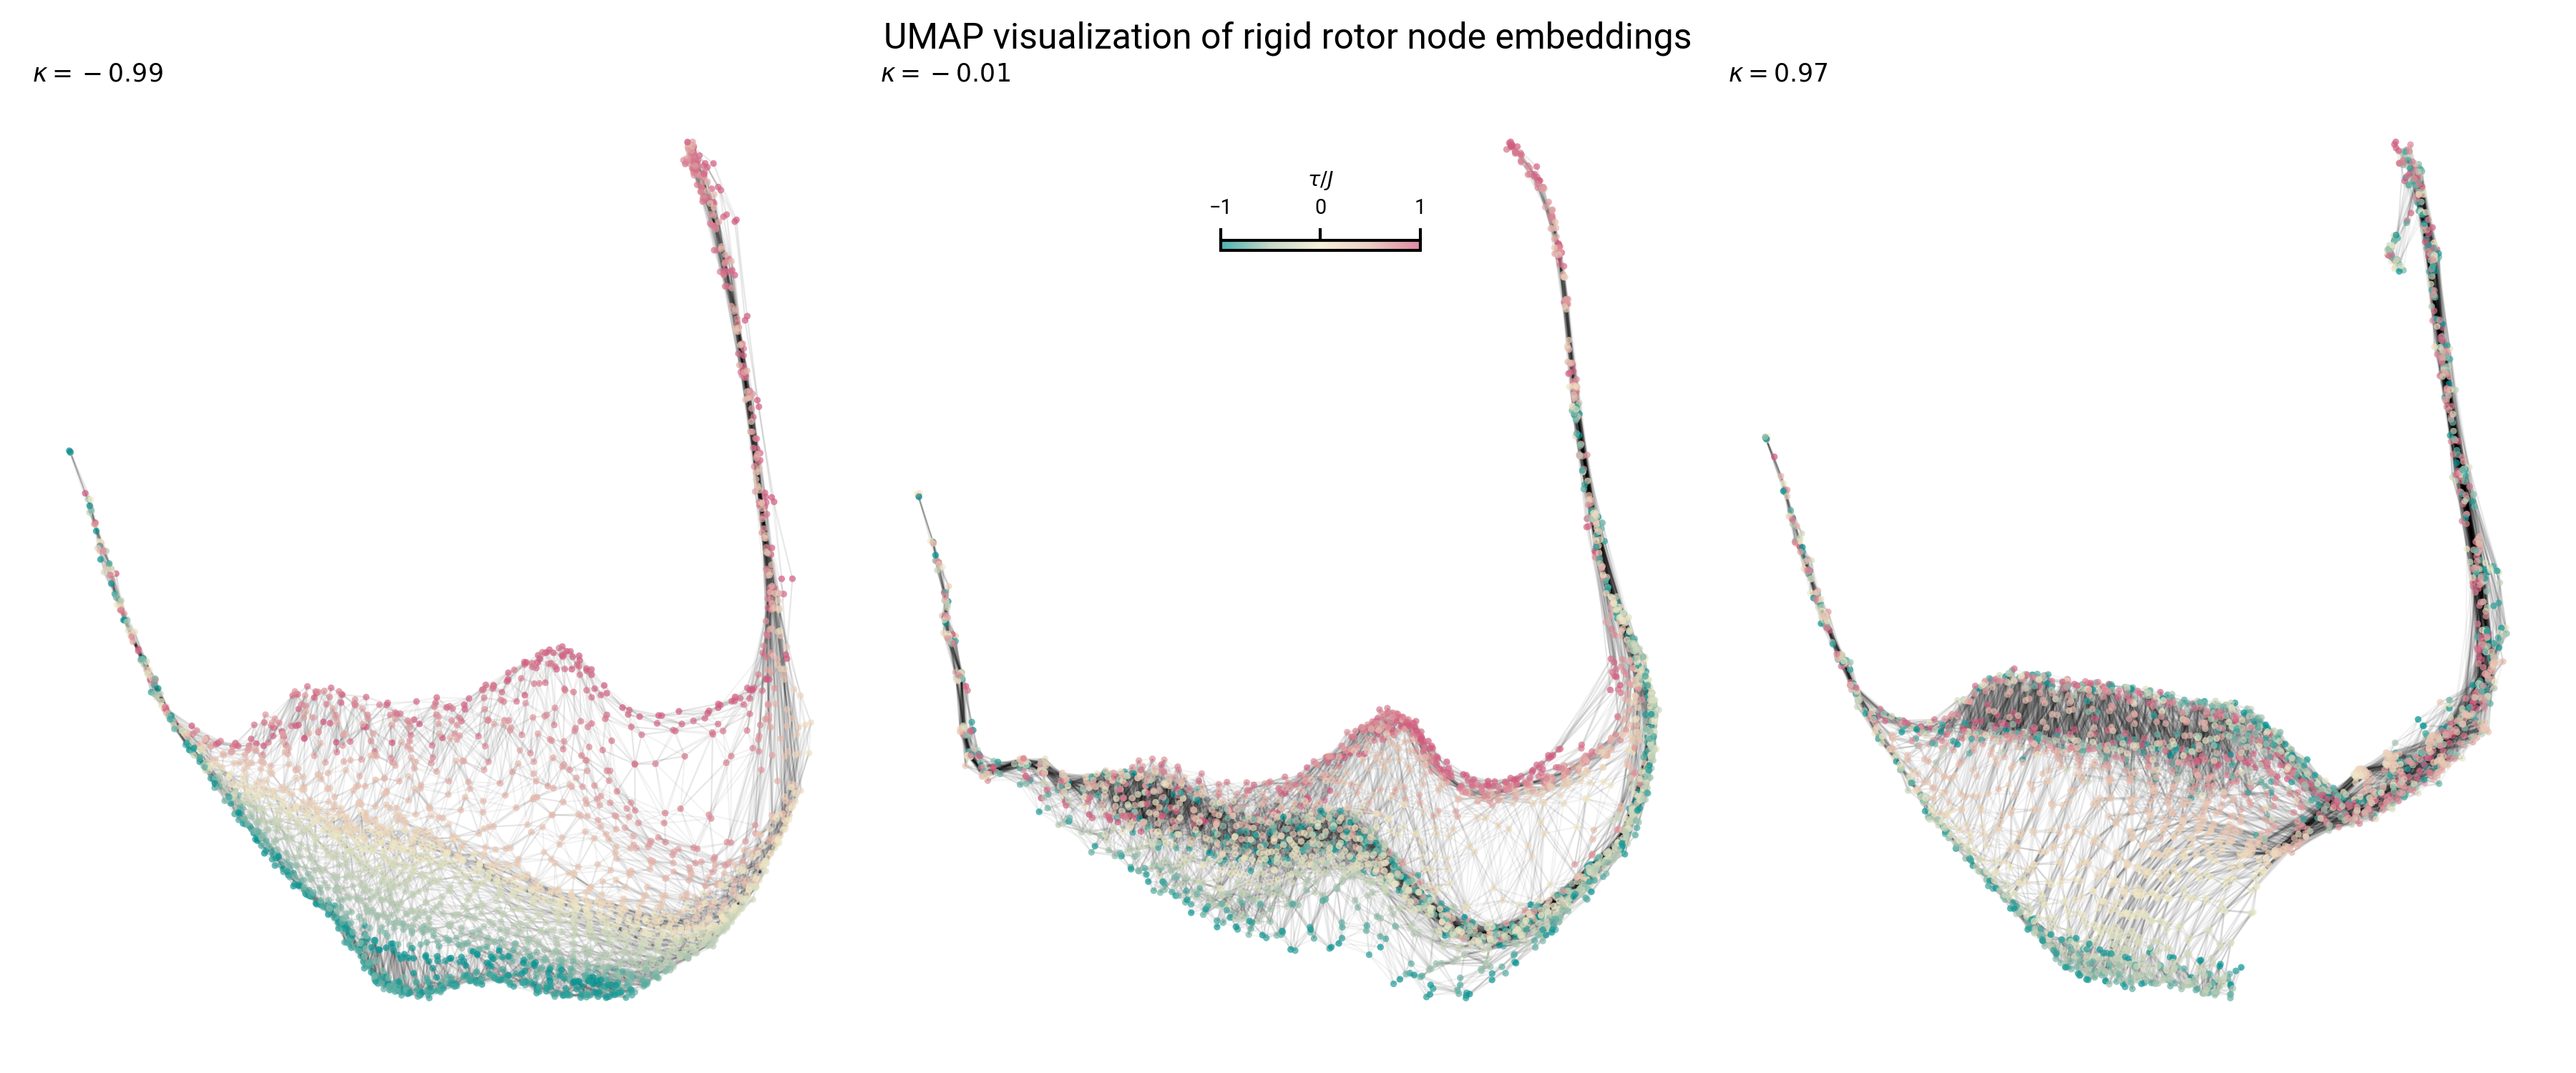
Topology of node embeddings contain quantum number information
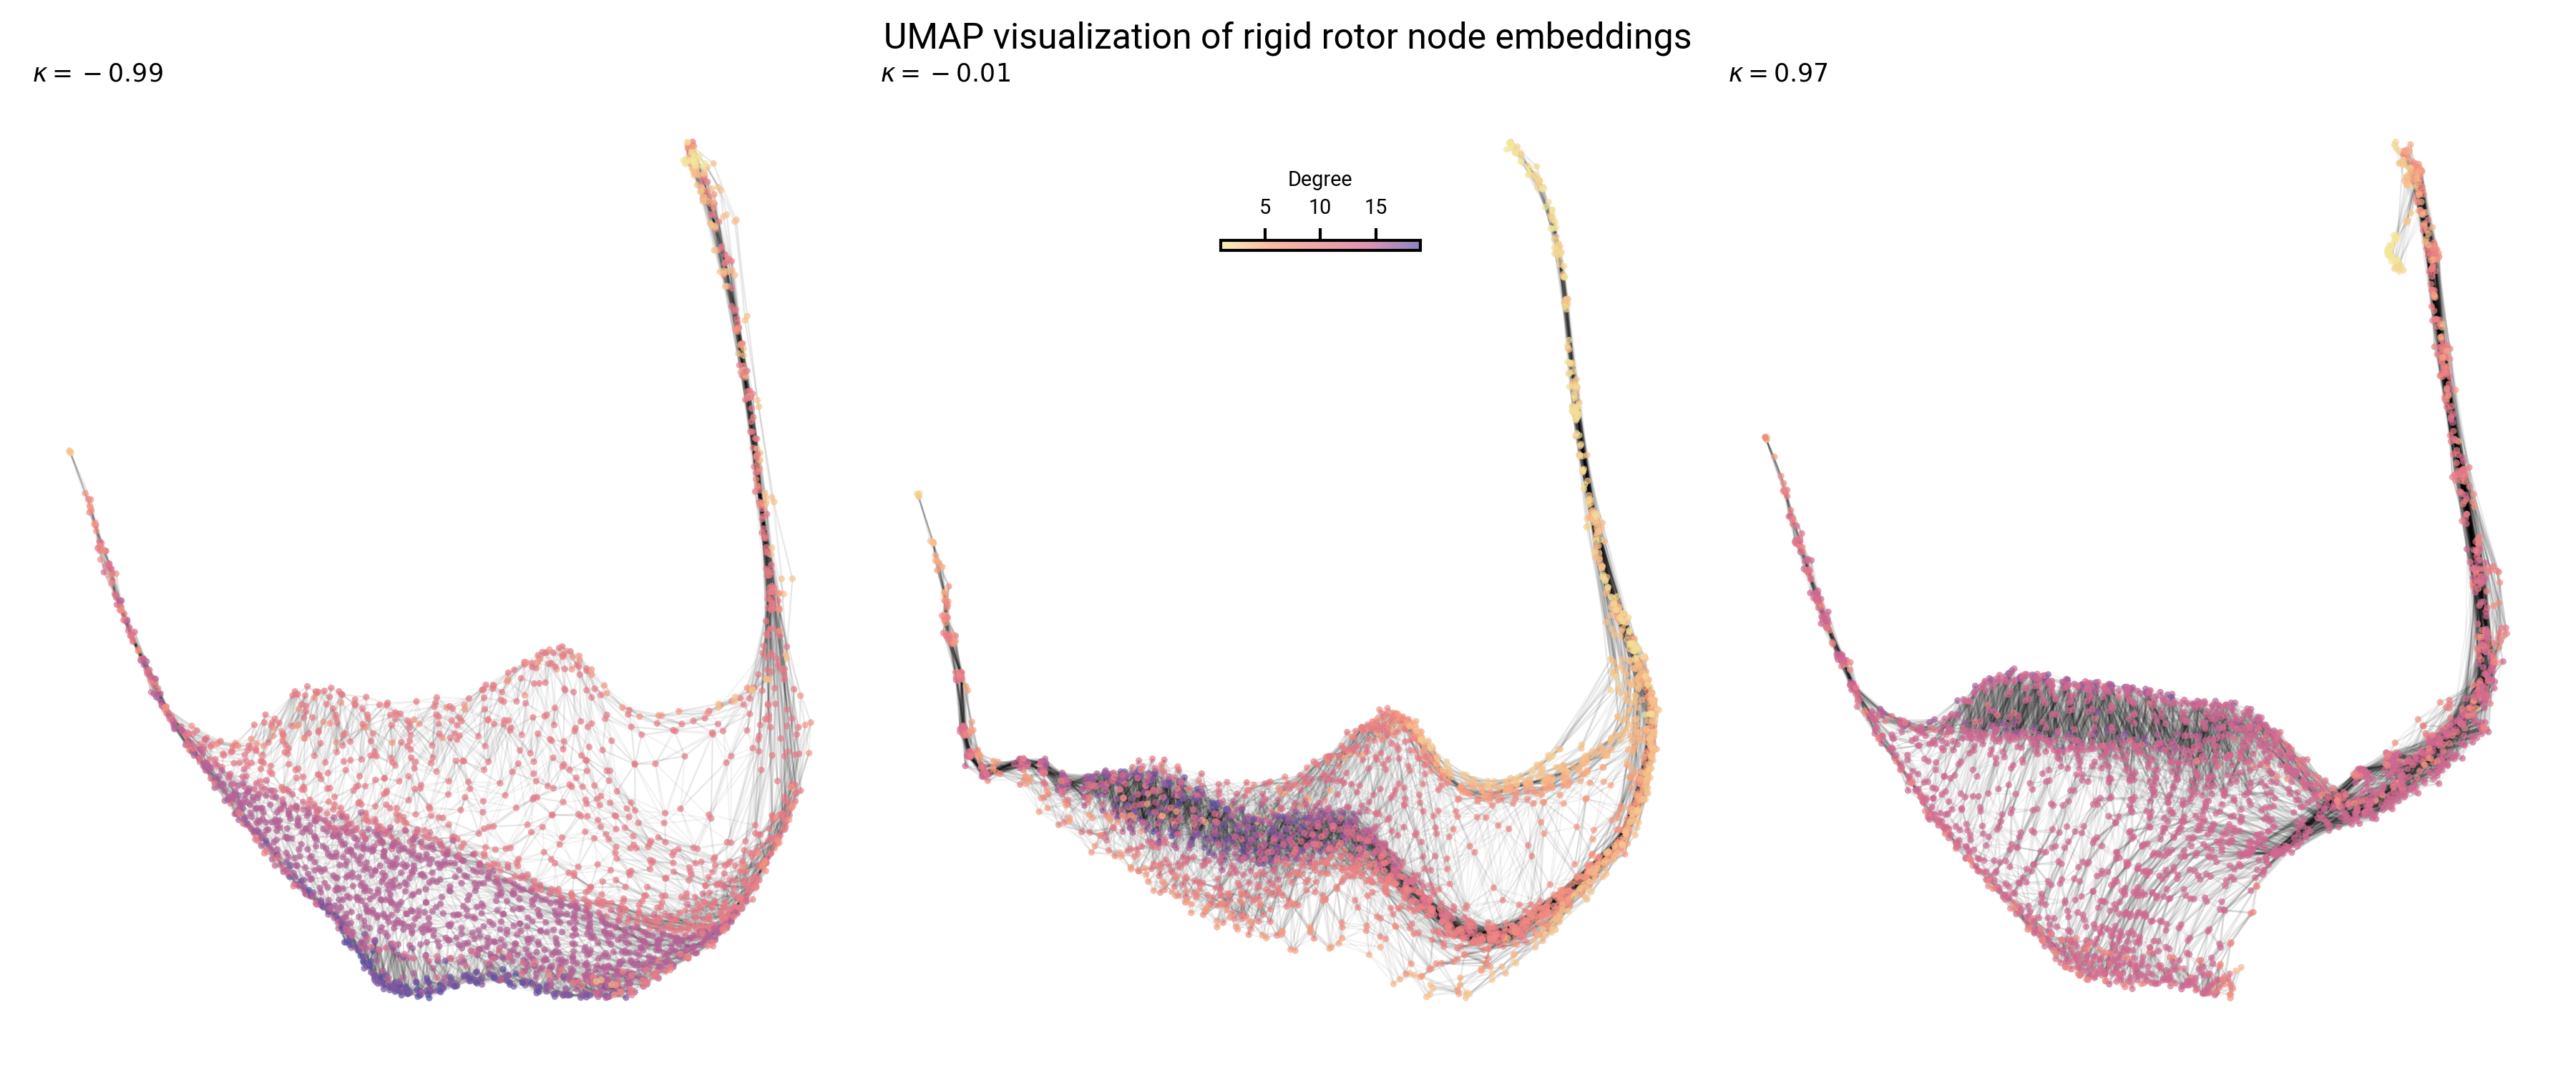
Topology of node embeddings contain neighborhood information
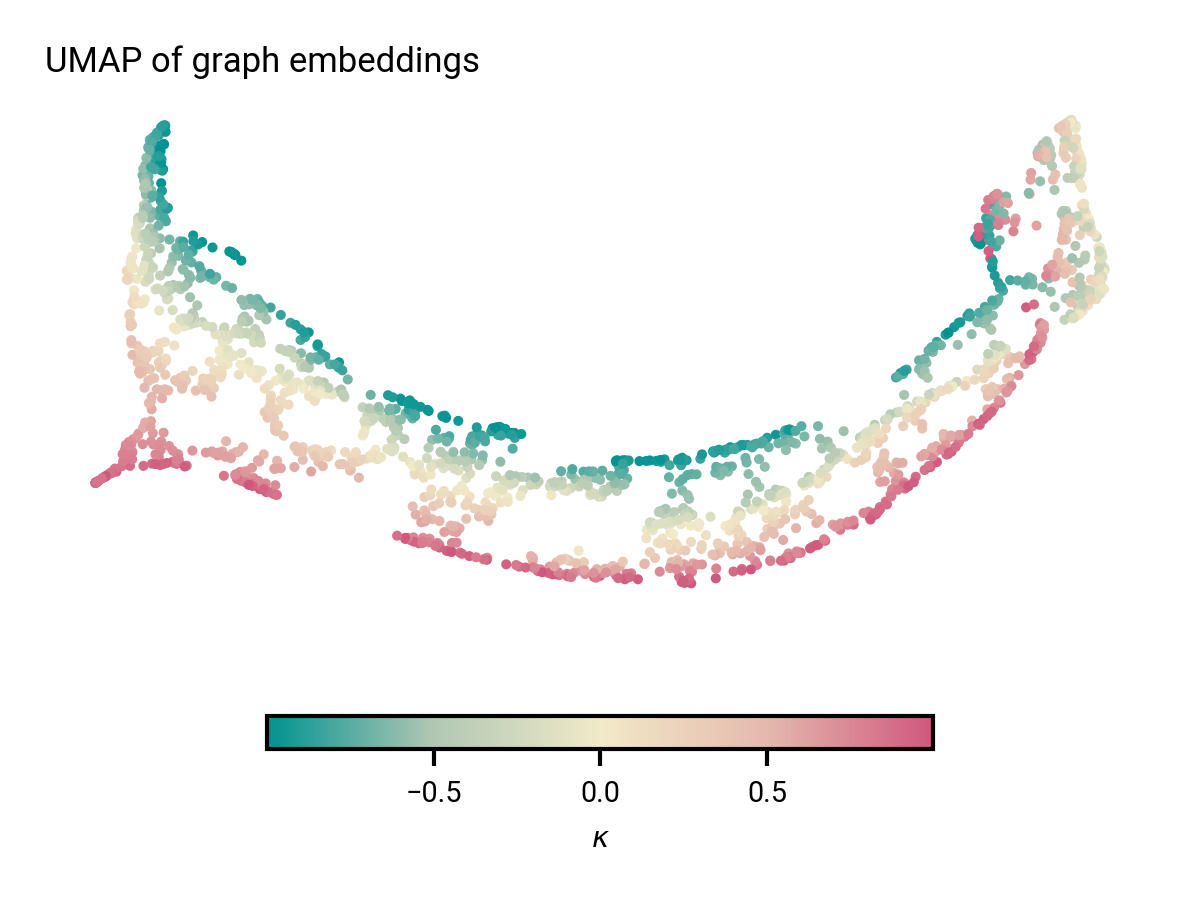
2000 graphs from validation set
Graph embeddings contain asymmetry information
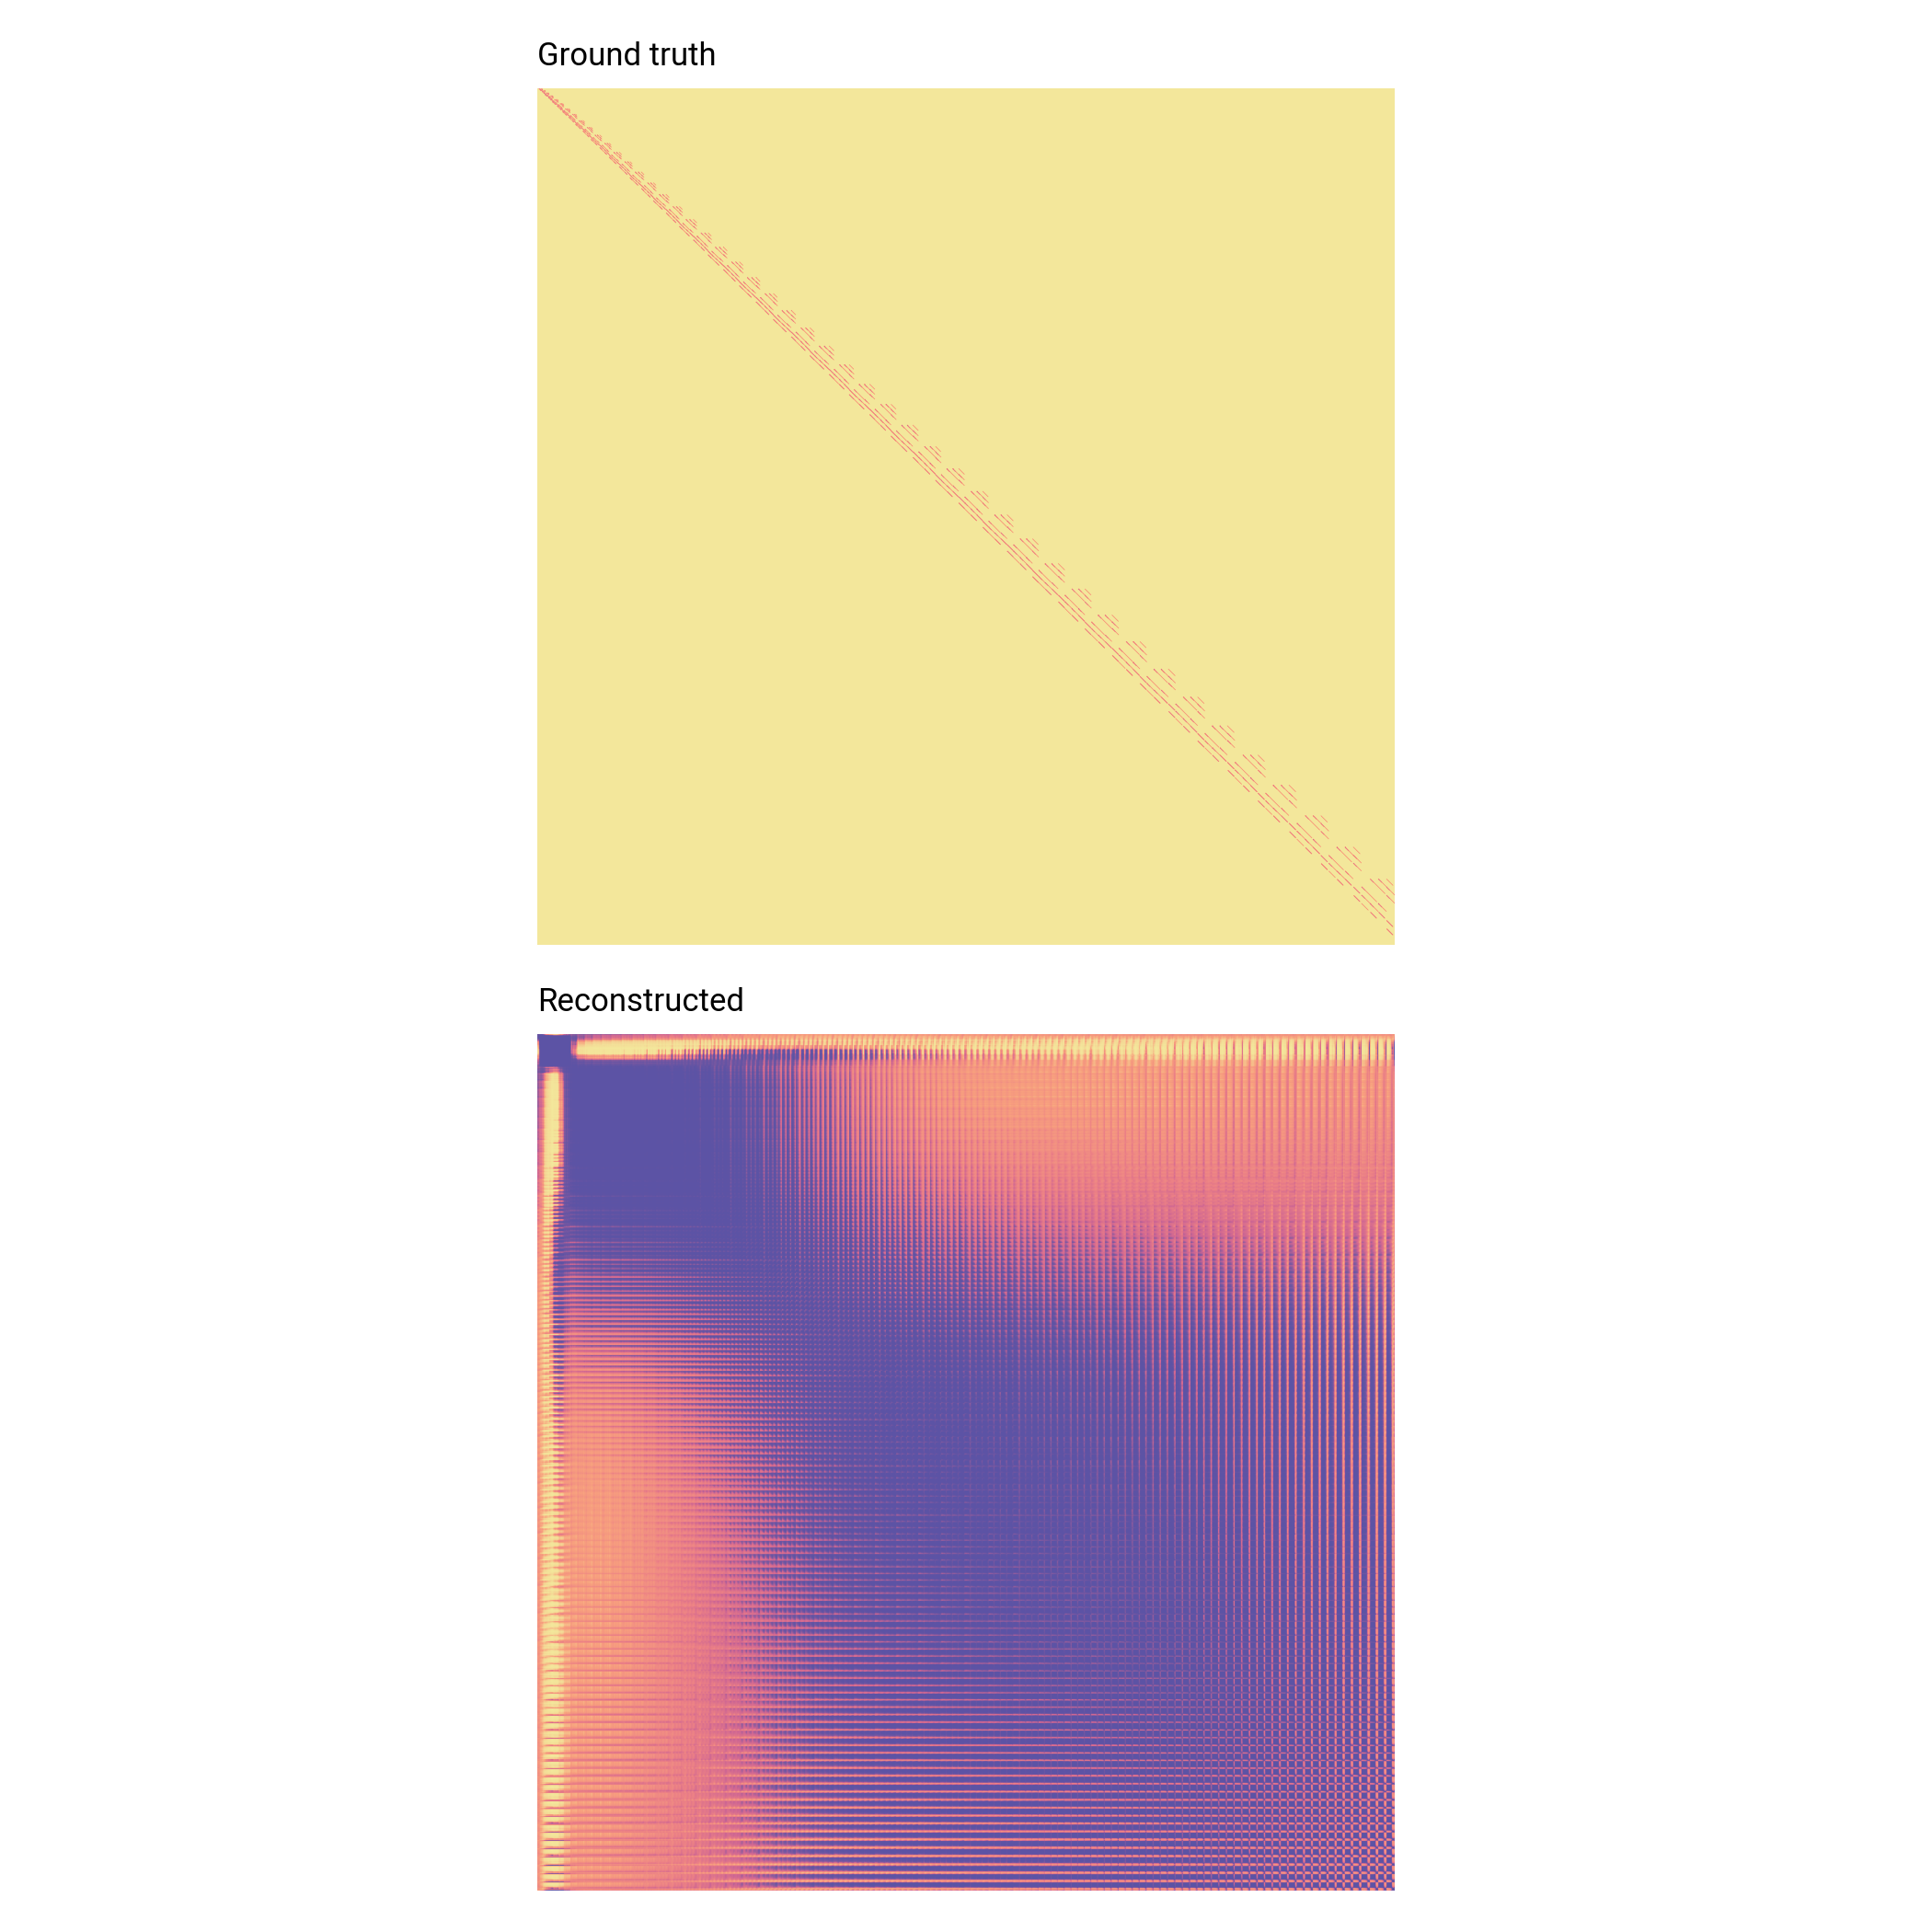
Reconstructed graphs
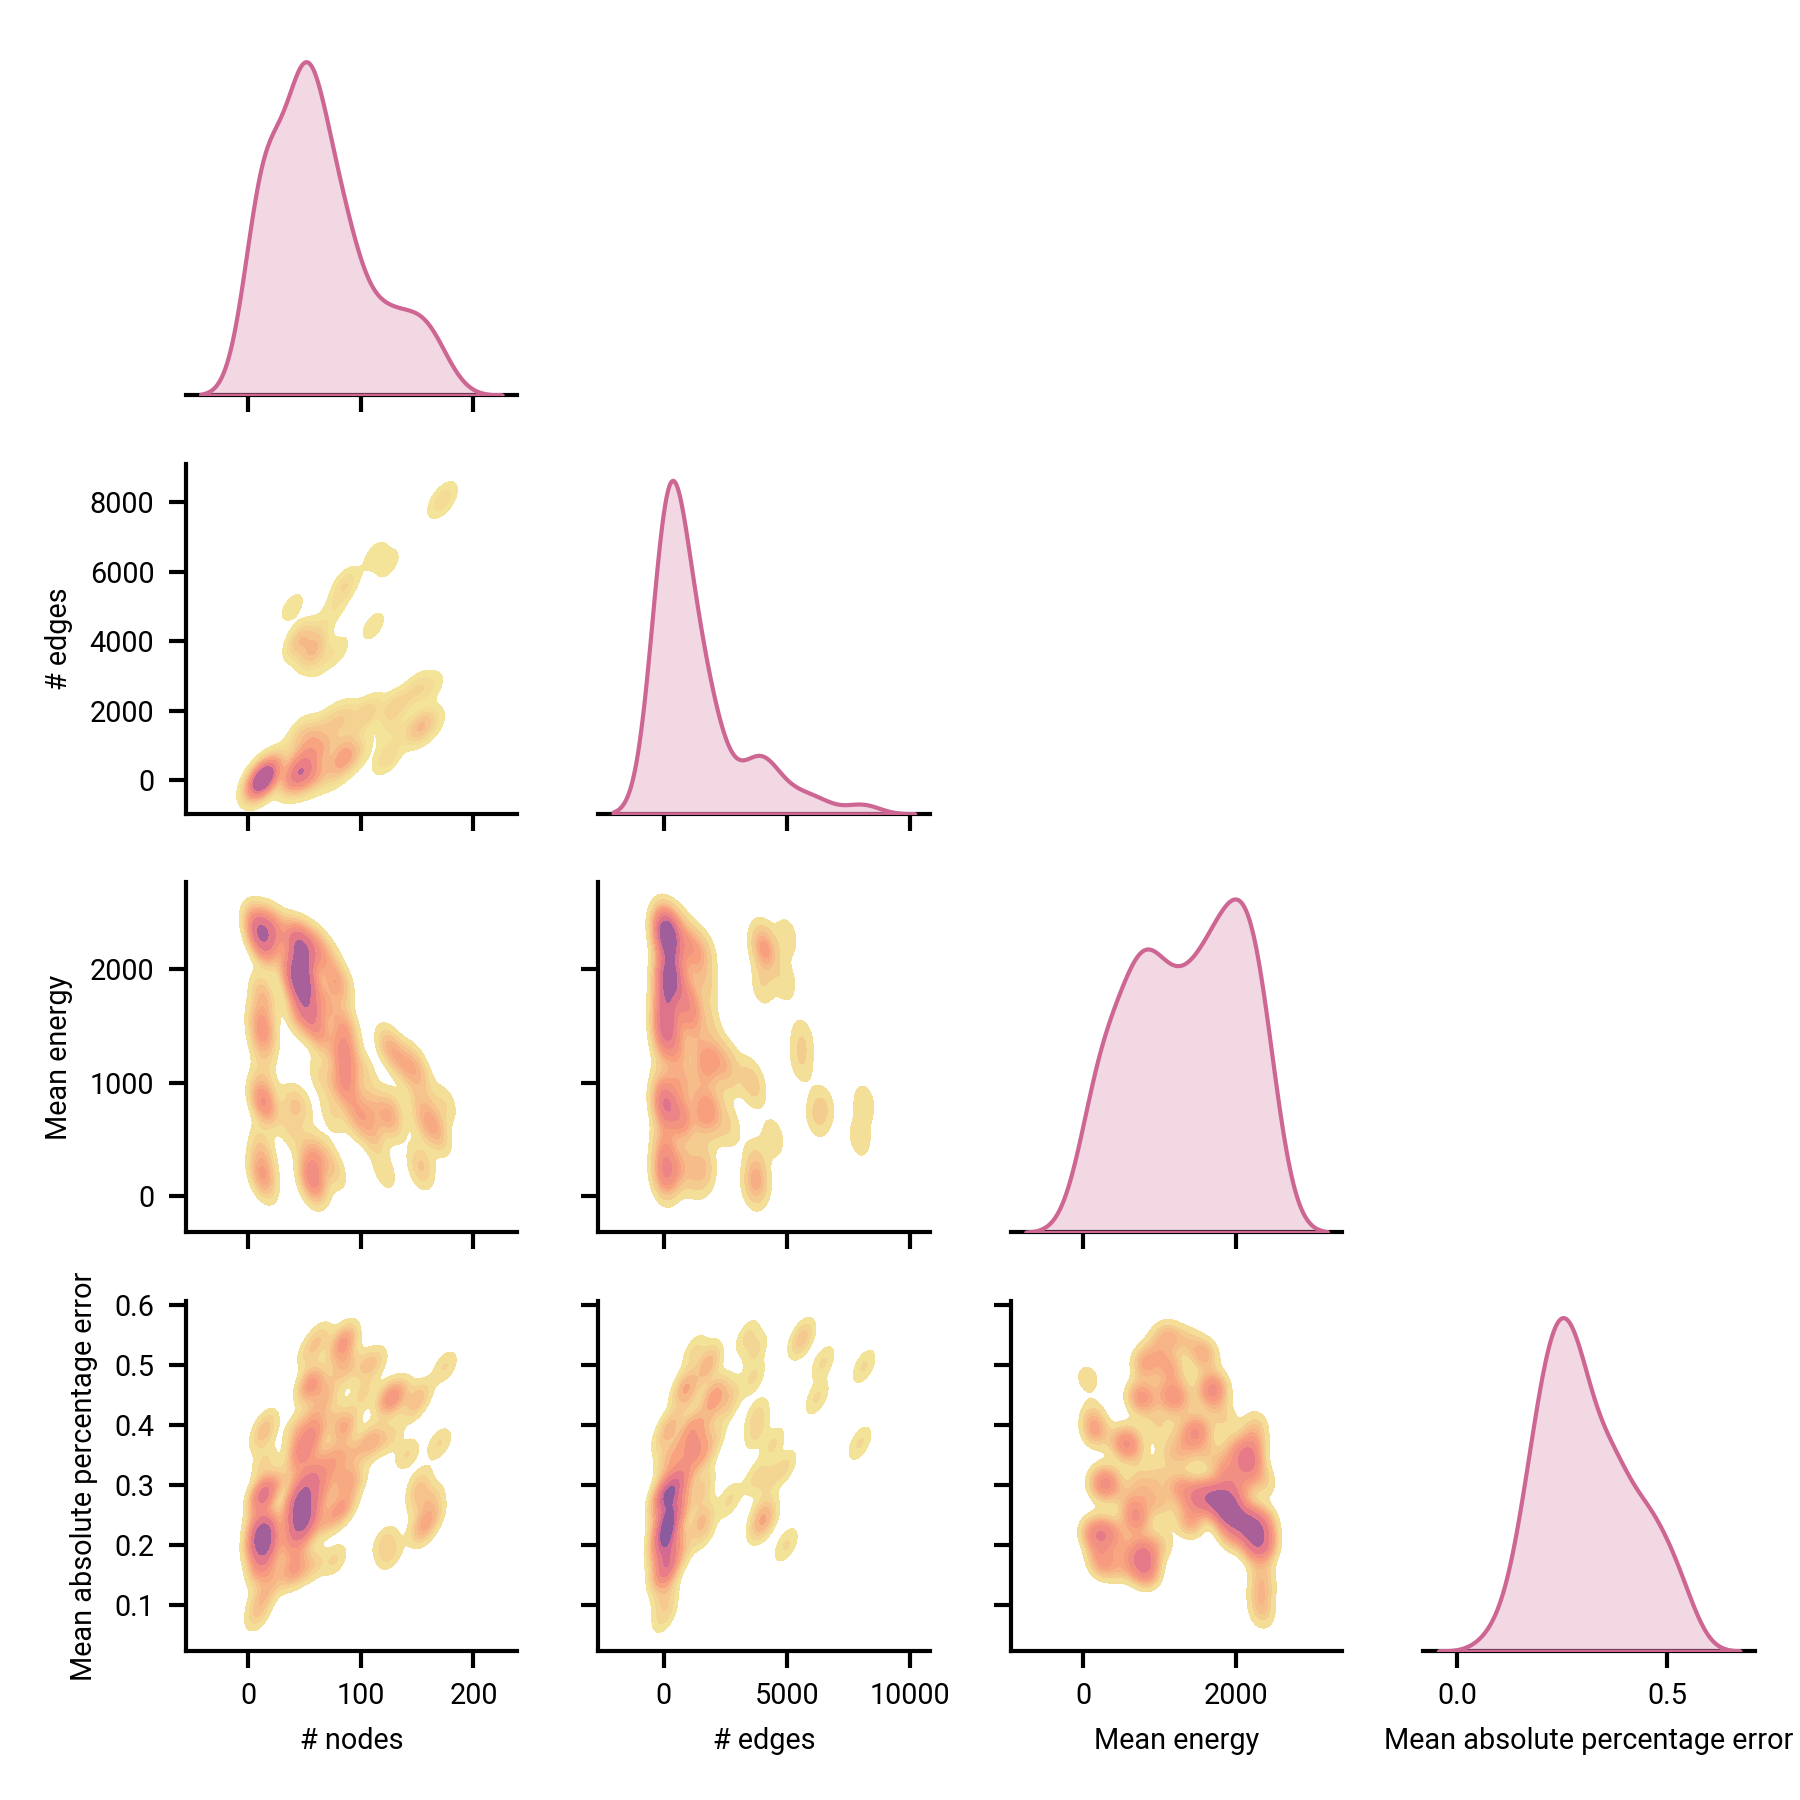
How accurate/precise are the models in reproducing spectroscopic parameters and linkage?
Dependent variables for spectroscopic parameter estimation
- Typical accuracy ~20% for $B, C$
- Correlated with # nodes/edges
- Invariant to energy scale
Link prediction
Simple A/B testing indicates >95% ROC AUC score (i.e. correct linkage prediction 95% of the time)
Energy levels are incredibly sparse—not the true error!
Need to improve on edge training sample scheme
Conclusions
Applying graph principles toward automating spectral analysis
Graph neural networks able to learn information-rich node and graph embeddings
Linkage prediction is far from accurate—need to revise training strategy
Acknowledgements
Thank you!
Applying machine learning to molecular spectra
Use graph representations of rotational spectra
Graph/node embeddings successfully capture spectroscopic intuition